A Self-supported Auxiliary
Oregon State University Transportation Services is a self-supported auxiliary. This means that all revenue collected supports the services and infrastructure for parking on the OSU Corvallis campus.
In addition to the services that we provide, we own, maintain and replace equipment and facilities including approximately 57 acres of surface parking lots, the parking garage, Beaver Buses, bike lockers, and bus shelters.
Parking Fund Expenditures
Expenses related to parking operations include maintenance of parking facilities, vehicles and equipment, employee salaries and benefits, supplies, minor equipment, utilities, transportation options program and Beaver Bus operations.
Reserve Fund
Transportation Services maintains a Reserve Fund for capital expenses, like new parking lots, and for the maintenance or repair of parking facilities and capitalized equipment. The fund is replenished by transfers from the operating fund equivalent to the average estimated expenditures of our ten-year capital plan.
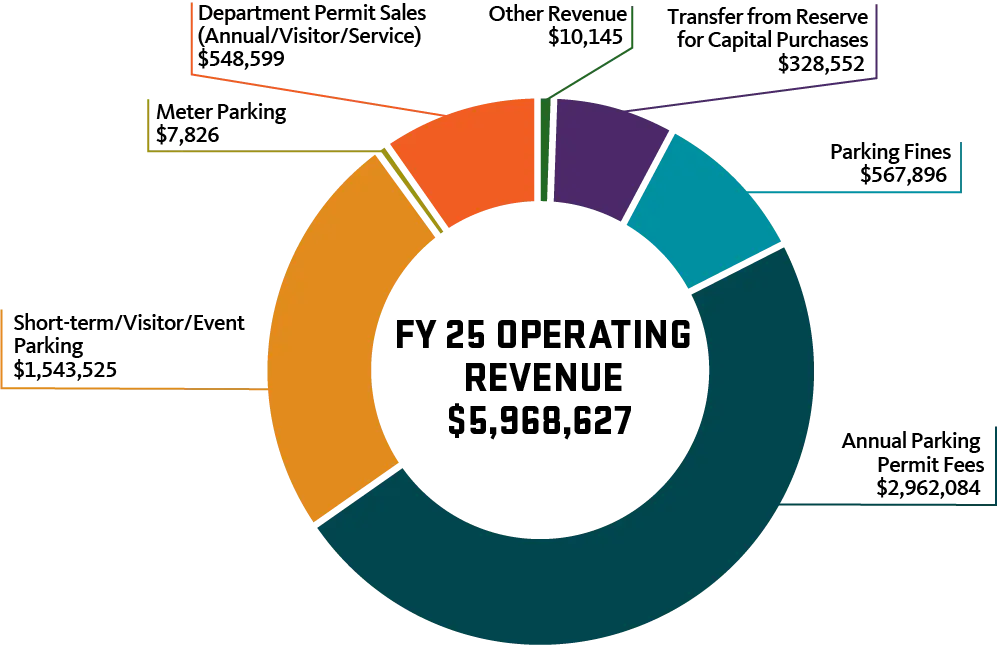
Parking Revenue
Parking revenue includes annual, monthly, and daily parking permit sales, parking meter payments, parking fines, internal sales (to OSU departments), and miscellaneous revenue from bicycle locker rentals, surplus sales and reimbursements from outside entities.
2024-25 Expenditures
This chart represents the expenditures made in Fiscal Year 2025 (July 1, 2024 through June 30, 2025). Revenues above operational expenditures are transferred to the unit's reserve funds for capitalized construction projects and equipment replacement.

2024-25 Revenue
This chart represents the revenue received in Fiscal Year 2025 (July 1, 2024 through June 30, 2025).
Past Fiscal Years
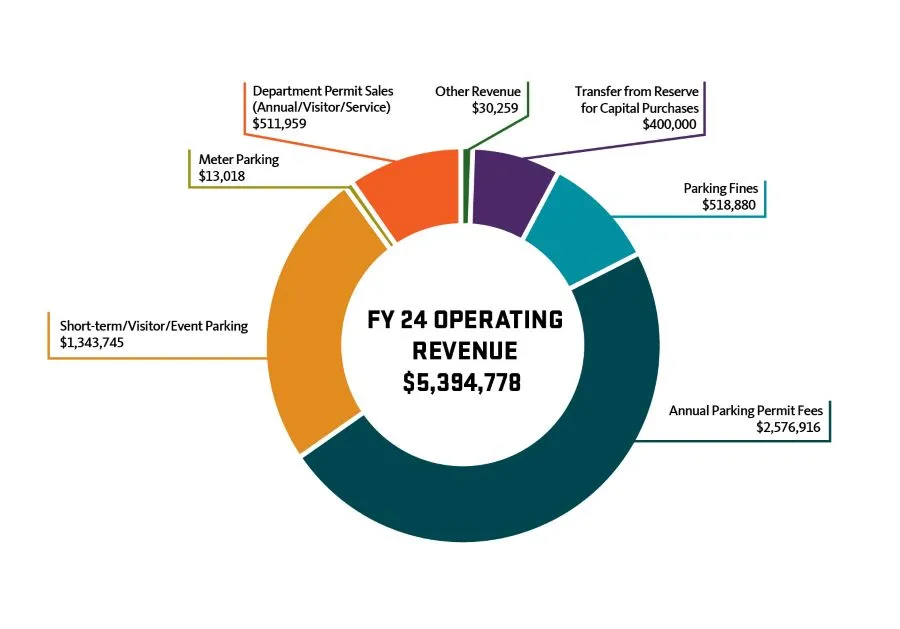
FY24 Revenue and Expenses
Expenses $5,467,464.52
- Includes transfer to reserve: $1,478,112.00
Revenue: $5,394,778

FY23 Revenue and Expenses
Expenses: $4,795,079.42
- Includes transfer to reserve: $1,665,670.00
Revenue: $4,675,661.26


FY22 Revenue and Expenses
Expenses: $4,015,022
- Includes transfer to reserve: $1.6M
Revenue: $4,024,856

